
A DAY IN THE LIFE OF THE PECONIC ESTUARY - OCTOBER 1, 2014
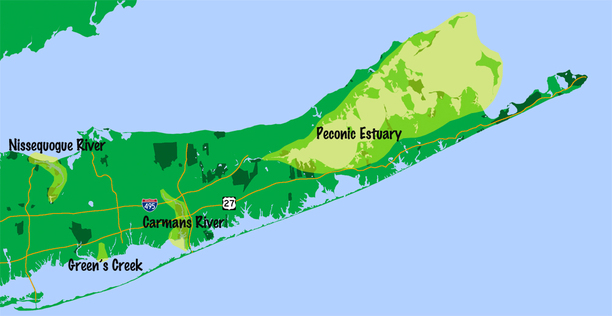
(October 1, 2014 - Riverhead, NY) On October 1st, thousands of students and volunteers from the East End of long Island collected data on the Peconic Estuary to be compiled into an official “Day in the Life of the Peconic Estuary” database. Three classes from the High School collected data during the day and the Middle School Environmental Club was invited to be a part of the program as well. The Environmental Club collected their data in the bay via the Atlantis Explorer boat.
Christopher McCrary's AP Biology class collected data from the Peconic River behind Roadhouse Pizza on Route 25 in Riverhead. (Most of the photos in this slideshow--except the two she was in--were taken by Jade McKrieth.)
Christopher McCrary's AP Biology class collected data from the Peconic River behind Roadhouse Pizza on Route 25 in Riverhead. (Most of the photos in this slideshow--except the two she was in--were taken by Jade McKrieth.)
Claire Yannacone's HS science class and John Barona's Living Environment and Forensic classes traveled to Indian Island to collect data.
The Environmental Club and their advisor, RMS science teacher Kristen Realander, felt fortunate to be paired with Atlantis Marine World and collected data out in the bay via the Atlantis Explorer boat. RMS science teacher Matt Moorman and Annie from Atlantis were also helping the students collect data.
Mrs. Realander shared, "The students worked to gather as much data as possible. In our time on the beach, we measured air temperature, soil and water temperatures, current speed, tidal change, collected biological specimens to identify, made a map of the area, and ran chemical tests to check on the salinity and oxygen levels in the water. Despite being a little cold and wet, a great time was had by all."
Mrs. Realander shared, "The students worked to gather as much data as possible. In our time on the beach, we measured air temperature, soil and water temperatures, current speed, tidal change, collected biological specimens to identify, made a map of the area, and ran chemical tests to check on the salinity and oxygen levels in the water. Despite being a little cold and wet, a great time was had by all."
 A Day in the Life
The students performed the following tests and the data they collected is available on the Portal to Discovery website.
- Aquatic Biological Survey
- Biodiversity Inventory Survey
- Habitat Association Survey
- Water Temperature
- Turbidity
- Water pH
- Salinity
- Dissolved Oxygen
- Tide Measurement
- Current Direction and Spped
- Cloud Cover and Air Temperature
- Wind Direction and Speed
- Physical Characteristics of the Site
- Map of the Site
- Sediment Sample of Shoreline, Site Bottom
- Photographs of Site (taken by students)
- Images of all Interesting Animals/Plants to be Identified
- Images of other group members in action
The Riverhead Central School District would like to thank all of the participating groups who organized this amazing educational experience. Volunteers from the Long Island Science Center, the NYS Department of Environmental Conservation and the U.S. Geological Survey (USGS) and Atlantis Aquarium Explorer staff members assisted RCSD science teachers and assistants with the collection of the data and provided our students with models for future career choices.
SEE LINKS BELOW FOR INFORMATION COLLECTED:
We measured 15.4 cfs streamflow, which converts to 115 gallons per
second, 38 million liters per day, or you can convert to any units
here: http://md.water.usgs.gov/cfscalc/
Guess what - since your students made such a good measurement, I even
included "RHS" as the measuring party:
http://waterdata.usgs.gov/nwis/measurements/?site_no=01304500
Here are a few links with details and diagrams:
http://water.usgs.gov/edu/measureflow.html
http://water.usgs.gov/edu/rivers-contain-groundwater.html
http://www.usgs.gov/homepage/science_features/water_scientist.asp
